¡@ MENU A¡@ B¡@ C¡@ main

hkg_19y

hkg_3m

hkg_5d


¡@

¡@ ¡@ ¡@ ¡@ ¡@
¡@
¡@ ¡@ ¡@ ¡@ ¡@
Normal yield curve Steep yield curve Flat or humped yield curve Inverted yield curve ¡@
¡@
The US dollar yield curve as of February 9, 2005. The curve has a typical upward sloping shape.

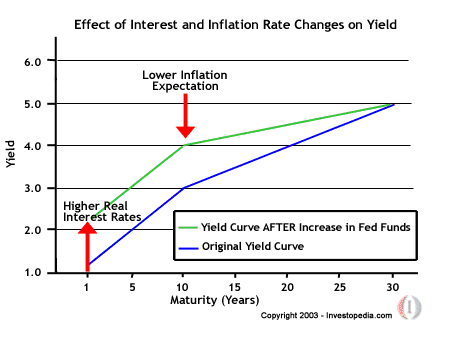
The normal yield curve is upwards sloping because long-term bonds are more risky than short-term bonds and investors expect to be compensated with higher yields. Steepness is also an important consideration. If the below curve was steeper it would likely be because investors believe the economy will grow very quickly such as at the beginning of an economic expansion following a recession.

Steep Yield Curve:  Sign of Economic Recovery?

A steep curve can occur when the small percentage gap between the shortest maturity bonds (i.e. three-month T-bills) and the longest maturity bonds (i.e. 30-year Treasury bonds) widens because some economic force causes the short-term rates to drop more than long-term ones. A steep curve often forecasts a faster-growing economy because lower short-term rates make it easier for companies to borrow money to expand their operations.

In reality the yield curve can take on many shapes.

¡@

A hump-backed yield curve is a combination of each of the shapes above and like the flat yield curve can be interpreted as indicating a transitionary phase. The hump can be above short and long rates or can be a dip below them.

The British pound yield curve on February 9, 2005. This curve is unusual (inverted) in that long-term rates are lower than short-term ones.

Inverted curves are rare and reflect an expectation that inflation will be subdued in the future and often implies an impending recession.

¡@

10000 for EEC (at Greece event)

1300y for Ireland

2000y for Greece

?? 3000y for Portugal

total: 6300 y

available: 3700y (if Spain needed)

?? another 1000y

¡@

¡@

CDS PRICING

¡@
¡@ ¡@ ¡@
tradingeconomics ¡@ ¡@ ¡@ ¡@
¡@ ¡@ ¡@ ¡@ ¡@
The British pound yield curve on February 9, 2005. This curve is unusual (inverted) in that long-term rates are lower than short-term ones.

Read more: http://www.answers.com/topic/yield-curve#ixzz1DUv8n2N6

¡@

¡@

at 28 Nov 2010

cty + 10 yield + cds

Greece >11% , 1024pt

Irland 9.42%, 600pt  (need 900y)

P 7.237% 510pt  (need 1500y)

Spain 5.202%, 312 pt (need 3000y)

Italy  4.439% 209pt

¡@

efsf EUROPEAN FINANCE STABILITY FLEXIBILITY

7500 Y (W/O IMF 4400Y)

UPDATED TO 8000Y

Max: EEC 600Y ESF 4400Y IMF 2500Y = 7500Y

Net (EFSF 60% b/c 3a bond as security) + 2640y

EEC = 600y IMB<5740y  (spain portion = 100y)

ie net of Spain = 5640y

¡@

cds-master

¡@

¡@

Portugal 10 Year (GSPT10YR:IND)


PORTUG CDS USD SR 5Y

CPGB1U5:IND

10 Year (GDBR10:IND)

IRELAND CDS USD SR 5Y

CT777651:IND)

Greece 10 Year (GGGB10YR:IND)

Greece CDS USD SR 5yr

CGGB1U5:IND

Spain 10 Year (GSPG10YR:IND)

SPAIN CDS USD SR 5Y

CSPA1U5:IND

¡@

¡@

10 Year (GDBR10:IND)

GERMAN CDS USD SR 5Y

CDBR1US:IND

¡@

french 10 Year (GFRN10:IND)

One-Year Chart for FRTR CDS USD SR 5Y (CFRTR1U5:IND)

10 Year (USGG10YR:IND)

¡@

ITALY CDS USD SR 5Y

CITLY1US:IND

¡@

¡@

¡@

¡@

¡@

¡@

¡@

¡@

¡@

¡@

¡@

¡@

¡@

¡@

¡@

¡@

¡@

¡@

¡@

¡@

¡@

¡@

¡@

¡@

¡@

¡@

¡@

¡@

¡@

¡@

¡@

¡@

¡@

¡@

¡@

¡@

¡@

¡@

¡@

¡@

¡@

¡@

¡@

¡@

¡@

¡@

¡@

¡@

¡@

¡@

¡@

¡@

¡@

¡@

¡@

¡@

¡@

¡@

¡@

¡@

¡@

¡@

¡@

¡@

¡@

¡@

¡@

¡@

¡@

¡@